
PathPatron Use-Case Canvas series — 5 of 7
The map from the previous article has made the route visible: who does what, where work waits, where it returns, and which hand-offs create friction. It has also left Maya with a deliberate list of hypotheses, information gaps and critical points, each with a validation owner.
This article does the next job. It asks what happens because that mapped pattern continues to happen — and whether the evidence is strong enough to spend the organisation’s next piece of energy on changing it.
That is not an invitation to make an inflated ROI slide. It is a way to turn a real route — waiting, rework, late control checks, status chasing and constrained expert attention — into an honest decision. The question is not, “How large a saving can we claim?” It is, “What is the credible burden of leaving this as it is, what do we still need to validate, and does that justify looking at options?”

Continue the same case: the map starts to carry a cost
Return to the supplier-onboarding request Maya mapped with Procurement, Legal, Finance, the business owner and the supplier. At 09:07, Procurement receives an incomplete response. Legal later finds the missing clause. Finance sees bank details only the next day and fails a validation check. The business owner asks for a date nobody can safely promise.
On the working map, those are not abstract frustrations. They are connected steps: supplier sends partial material; Procurement chases and forwards; Legal returns a missing requirement; Finance waits, then rechecks; Procurement answers another status request. Some branches start before the supplier has completed the rest. The route loops back.
Maya now adds a second layer to the same step cards and to the validation list she started in Article 4:
- Time: Procurement spends 18 minutes chasing the missing clause; Finance spends 12 minutes locating and rechecking bank data; the requester spends 10 minutes asking for an update.
- Repeatability: in a sample of 12 recent requests, five arrived incomplete and four needed a second Finance check.
- Consequence: a delayed activation moves a dependent project task, but it does not yet prove lost revenue.
- Confidence: timestamps and sample counts are evidence. The impact on the project plan is a hypothesis for the business owner to validate. The severity of the late bank-data check belongs with the relevant control owner.
- Human impact: repeated chasing leaves Procurement unable to give the supplier a reliable answer. That is an observed frustration signal; it is not yet evidence that a customer will leave or an employee will resign. Maya records it, its source and the person who can test its severity.
The cost of not solving is therefore not one dramatic number hidden in a spreadsheet. It is an evidence ledger: a visible record of monetary burden, non-monetary human and relationship harm, and other decision-relevant consequences, each tied to the mapped route and labelled for what it is.
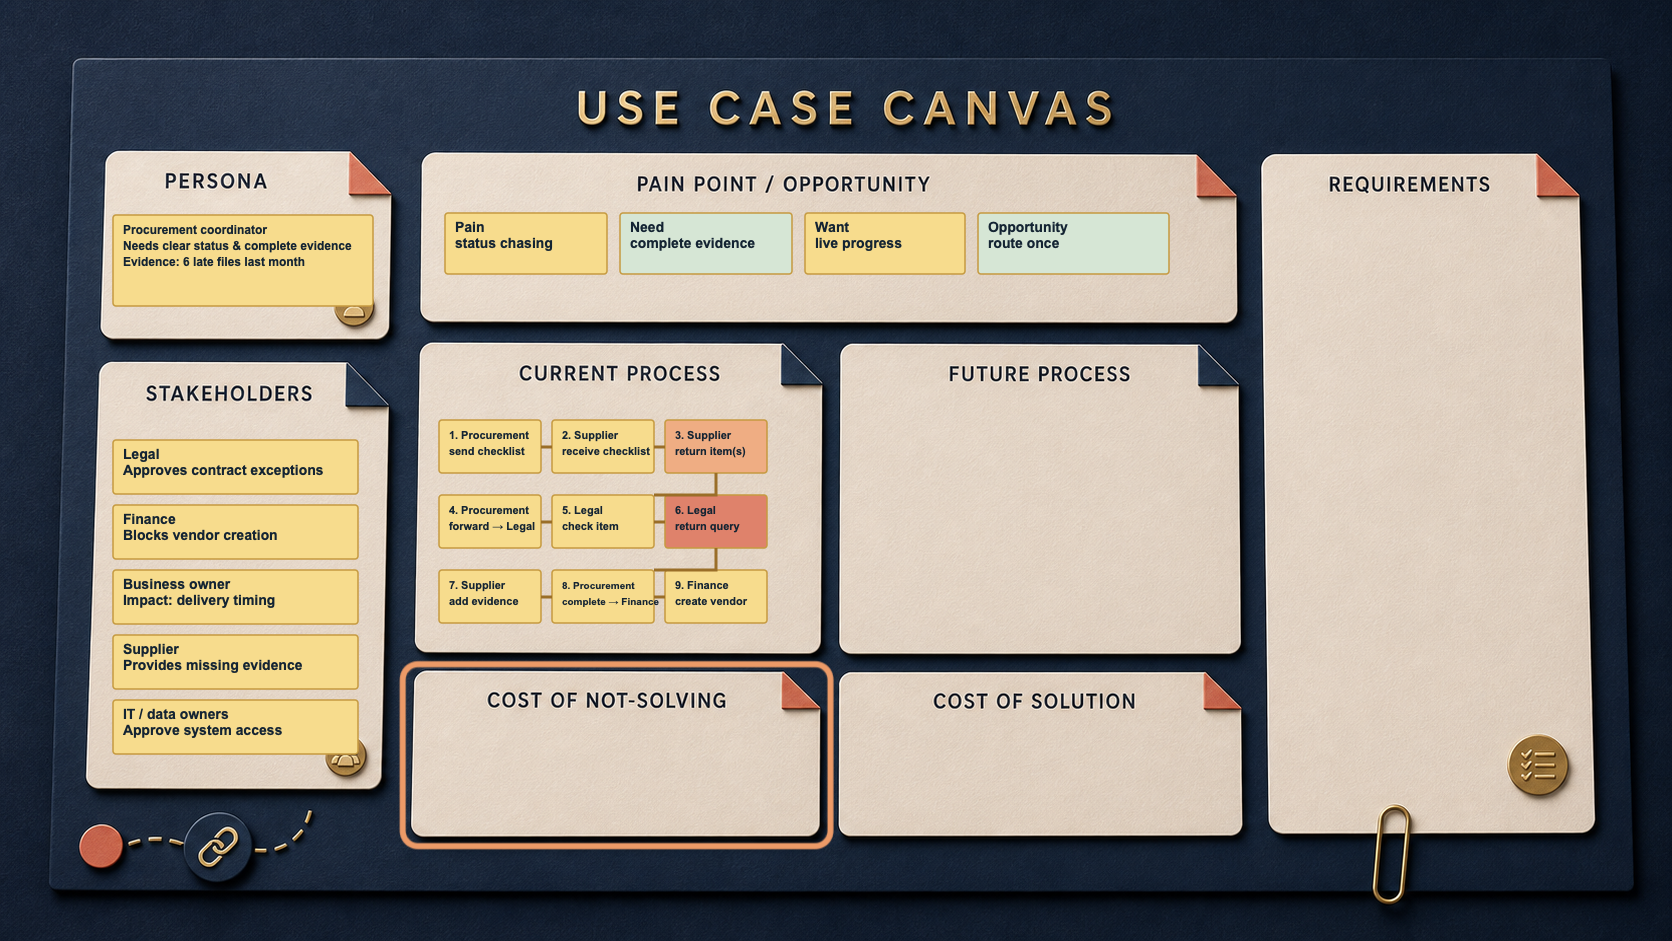
Before the activity: carry the route forward, then add evidence
Maya does not open a blank Canvas or reopen the process debate. She brings Article 4’s validated Current Process, its branches and loops in the detailed Work Map, and its validation and critical-points list. Online, the team adds evidence cards beside the route in its approved whiteboard; in the room, it uses the same cards beside the printed Canvas. One card makes one traceable claim: what happened, to whom, how often, with what source and what still needs validation.
The activity has three buckets. Monetary cost is work or loss that can be credibly counted or ranged. Non-monetary cost captures employee, customer, supplier or partner friction, confidence and trust—even where it would be misleading to price it. Other things to consider holds rework, risk, control, service and opportunity consequences that inform the decision but must not be quietly converted into money.
What belongs in the cost picture
Use the map to capture six kinds of current-state burden. Do not force every category into euros. A count, a range, a trend or a named risk can be more decision-useful than false precision.
1. Direct effort and waiting
Count work genuinely repeated: chasing information, copying data, rechecking, drafting updates and reconstructing status. Keep work time separate from elapsed waiting time. A case waiting three days is not three days of staff cost, though that delay may still block a customer, project or control.
In this case, the 18 minutes of follow-up and 12 minutes of Finance rechecking are 30 minutes of direct avoidable cross-functional effort. The separate ten-minute status request is service friction, not part of the direct-effort proxy. The next-day Finance queue is a delay to record, not 24 hours of salary cost.
2. Rework and quality loss
Look for returned requests, rewritten documents, re-entered data, duplicate checks, escalations and corrections. Then ask what creates the repeat. Missing information, unclear decision rights and inconsistent source material usually deserve attention before automation.
Five of 12 requests missed information Legal needed; four needed a second Finance check. The map shows that incomplete intake — not either team working too slowly — is the repeat’s cause. That distinction matters for the eventual intervention.
3. Risk and control exposure
Record credible failure modes: untraceable approval, late detection of incorrect bank details, missed contractual evidence or inconsistent customer information. Do not price an unlikely incident as though it happens weekly. State the failure mode, current control, likelihood evidence and the owner who can validate severity.
Here, bank details reach Finance late enough to trigger a second validation. Record the control exposure and ask the control owner to assess severity. Do not turn it into a recurring incident cost without evidence.
4. Opportunity and service impact
If expert time is absorbed by routine coordination, name the higher-value work displaced. If delay affects a project milestone or customer response, name the dependency. Do not leap from “time saved” to “revenue created.” Value exists only when released capacity or a faster outcome has a credible use.
The business owner cannot safely promise an activation date, so a dependent project task waits. That is a named planning constraint, not yet a claim of lost revenue.
5. Non-monetary human and relationship cost
Document the lived consequence of the route as carefully as the time spent on it: repeated employee frustration, avoidable customer or supplier effort, reduced confidence in a service, escalation fatigue, loss of trust or a poorer experience for the people expected to use the process. These are real costs even when no defensible euro value exists.
Use evidence proportionately. Repeated complaint themes, pulse-survey comments, customer effort or satisfaction trends, account notes, escalations, exit-interview themes and renewal-risk signals may show a pattern. Record the signal, affected group, frequency, source, confidence and validation owner. Do not write “this will cause attrition” or “this will lose the contract” unless an accountable owner can substantiate that causal link. A severe, recurring customer or employee signal may justify urgent option modelling before it can be monetised.
In this case, Procurement’s repeated status chasing and the supplier’s need to resend material are visible service-friction signals. Maya asks the Procurement lead and business owner whether account notes, complaints or delivery feedback show a material trust or relationship consequence. Until then, the ledger records friction—not lost contracts or resignations.
6. Change load — the comparison that comes next
The burden of the current state must eventually be compared with the burden of solving it: redesign, integration, licences, data clean-up, controls, training and ongoing ownership. That is Article 6’s future-state comparison. Here, Maya does not select a tool. She decides whether the evidence warrants modelling options such as a better intake gate, a workflow hand-off or a bounded AI assist.
Where the evidence lives — and who validates it
Do not ask one manager for “the cost.” Evidence is distributed across the operating system.
| What Maya needs | Likely source | Best validation owner |
|---|---|---|
| Case volume, timestamps, queue time and reopen rate | Ticketing, CRM, workflow, inbox or ERP reports | Process owner or operations analyst |
| Steps, workarounds and hidden review | People who completed recent cases | Frontline practitioner and team lead |
| Cost-rate assumption or salary band | Existing finance/HR planning rates, approved cost bands | Finance partner or HR/people analytics |
| Errors, exceptions and controls | Audit findings, incident logs, quality reviews, policy records | Risk, compliance or control owner |
| Project, customer or service consequence | Delivery plan, account notes, service measures | Business owner or service lead |
| Employee, customer, supplier or partner friction | Complaint themes, survey comments, account notes, escalations, exit or retention signals | People partner, customer/service lead or account owner |
Start with internal sources of record. Google and AI can help find public benchmarks, interpret a report structure or draft questions; they cannot establish the organisation’s financial truth. If an external benchmark is used, record its source, geography, date, role definition and why it remains only a provisional proxy.
Use proxies without pretending they are facts
Exact data often do not exist yet. That should change the language of the estimate, not stop a decision.
For the supplier case, a transparent proxy is: in the observed sample, an incomplete request creates 30 minutes of avoidable cross-functional effort: 18 minutes of Procurement follow-up and 12 minutes of Finance rechecking. The 10-minute status request remains a separate service-friction line. Finance provides an approved planning range of €45–€65 per fully loaded hour. At 40 similar cases a month, the direct-effort proxy is €900–€1,300 a month. It excludes waiting time, project delay and risk, which remain separate evidence lines.
avoidable minutes per case ÷ 60 × approved hourly-cost range × monthly affected cases
Every estimate carries five labels:
- source — where the observation or rate came from;
- basis — sample size, date range and role definition;
- confidence — observed, proxy or hypothesis;
- exclusions — what is not in the number; and
- validation owner and date — who will confirm, replace or retire it.
A €900–€1,300 range is stronger than a theatrical €1,127.43. It makes both the evidence and its limits usable.
The anti-hype rules
The number does not become more credible because a sponsor wants the use case funded. Avoid:
- treating three exceptional cases as normal monthly volume;
- counting the same delay as both staff cost and revenue loss;
- treating frustration, a complaint or one exit interview as proof of a lost contract or employee attrition;
- converting every minute “saved” into cash when capacity will not be removed or redeployed;
- presenting a public salary benchmark as an approved internal rate;
- assuming AI removes review, exceptions, monitoring or recovery work;
- hiding uncertainty in one precise total; and
- ignoring the cost and ownership of the change itself.
“The pain is real, but the evidence is not yet strong enough to fund a solution” is a useful answer. It tells the team what to measure next and protects scarce delivery capacity.
Validate the material points, not a fictional ROI
This is not automatically another room full of sticky notes. The Article 4 board already holds the route, branches, loops and validation list. Use the lightest format that can resolve the uncertainty.
Default: prepare asynchronously. Maya or an approved AI assistant creates a one-page evidence pack from the Work Map, de-identified case notes and permitted operational reports. It separates observed evidence, proxy, hypothesis and information gap. The process owner, finance/contact-rate owner, business owner and relevant control owner add short comments. A 20-minute decision check is enough when the route is understood and disagreements are minor.
Use a 45-minute cross-functional session only when needed. Bring people together — in the room or on Mural/Miro — when the cost crosses several teams, a control owner disputes the risk, or evidence depends on conflicting views. The output is not a perfect ROI: it is agreement on the two or three assumptions that matter, their validation owners, and whether future-state modelling is justified.
| Time | Facilitation move | Tangible output |
|---|---|---|
| 0–5 min | Reconfirm the single mapped case and decision it informs. | Bounded scope; no solution assumed. |
| 5–13 min | Read the evidence ledger: steps, waits, rework, exceptions. | Shared facts and named gaps. |
| 13–22 min | Add monetary, non-monetary and other-consequence cards; keep each tied to a route step. | Cost categories without double-counting or invented causation. |
| 22–31 min | Turn only credible items into ranges or proxies. | Sources, exclusions and confidence labels. |
| 31–39 min | Challenge normal case/outlier, rate owner, capacity use and control impact. | Assumptions narrowed or assigned. |
| 39–45 min | Decide: validate, model options or stop. | Owners, date and decision record. |
Use AI to prepare, capture and compress — never to decide
Maya uses only an organisation-approved AI tool and only approved, de-identified material. It may not invent a rate, infer a regulatory consequence, turn a frustration signal into a retention or contract-loss prediction, declare risk likely, decide which work is avoidable or approve the estimate.
- Before: AI may structure the validated Work Map, permitted operational data and named open questions into a blank three-bucket evidence board. It labels every suggested card as Evidence, Proxy, Hypothesis or Information gap.
- During: it may capture agreed wording, calculate an explicitly supplied range, cluster duplicates and flag possible double-counting. It does not decide whether a signal is severe, establish causation or settle a dispute.
- After: it may make the one-page evidence pack readable and draft concise Canvas wording. Maya and the finance, process, business, people/customer and control owners validate every claim before it is shared.
Prompt template — prepare the evidence pack
Using only the approved, de-identified Work Map and operational data below, create a one-page cost-evidence pack for one use-case decision. Group observations into direct effort/waiting, rework/quality loss, risk/control exposure, opportunity/service impact, and non-monetary employee, customer, supplier or partner impact. For each item, state whether it is a monetary cost, non-monetary cost or another decision-relevant consequence. Label every statement Observed evidence, Proxy, Hypothesis or Information gap. For every non-observed item, name the role that must validate it. Do not invent rates, severity, causation, savings, revenue, attrition, lost contracts or regulatory consequences. Show exclusions and possible double-counting. Return the proposed next decision only as options: validate further, model future-state options, or stop. Materials: [paste approved material].
Activity visual: make the full burden visible
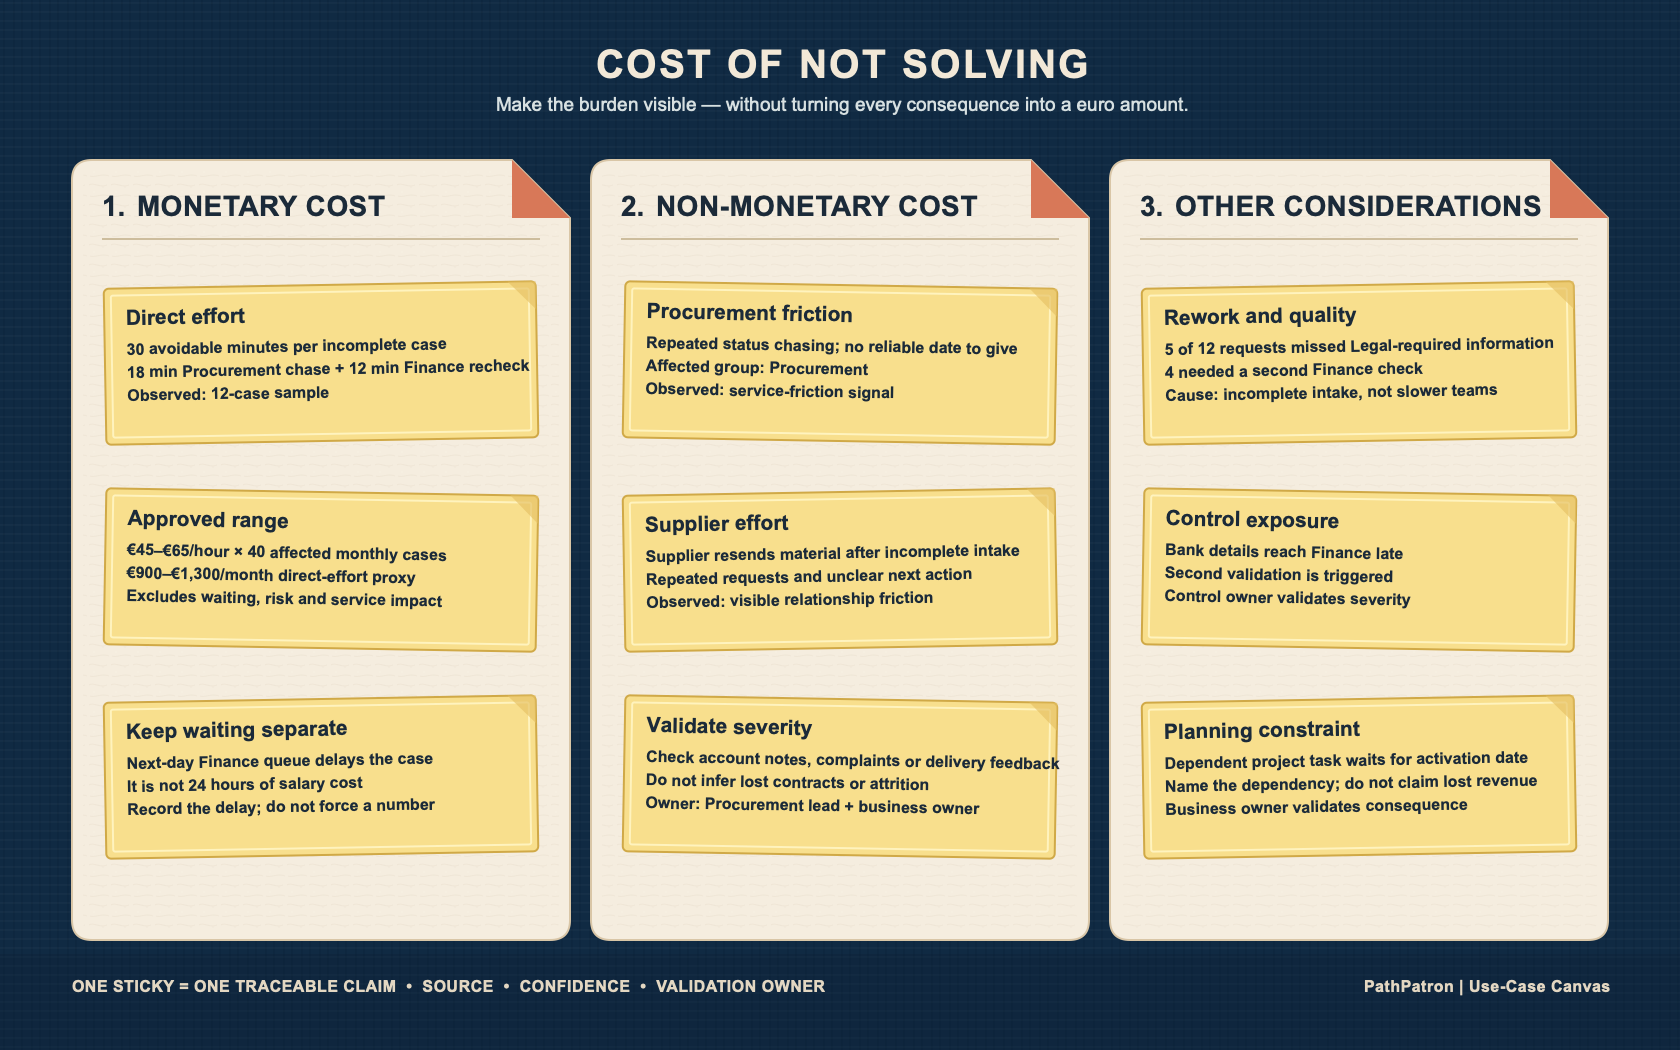
Use this board beside the Article 4 Work Map. Add an evidence card to the appropriate bucket, then connect it to the step or breakpoint that created it. Monetary cards can carry a transparent range when the rate and volume are approved. Non-monetary cards must name the affected group and the observed signal. The third bucket keeps rework, control, service and opportunity consequences visible without pretending all of them are cash savings. Every card receives a source, confidence label and validation owner.
The board is complete when the group can distinguish what it knows, what it can estimate, what people are experiencing, and what still needs an accountable person to validate.
What leaves this step
Maya updates the Canvas only with a concise summary: the material current-state burden, the evidence basis, the largest uncertainty and the decision. The detailed Work Map remains the source for step-level context; the evidence ledger remains attached to it. The ongoing validation/critical-points list does not disappear: its unresolved entries either receive an owner and date or become a stated reason not to proceed.
For the supplier case, the Cost of Not Solving field records only the decision-relevant summary: a direct-effort range, recurring supplier/employee service friction, a late bank-data control exposure, the largest evidence gap and the named next decision. It does not become a miniature spreadsheet or a claim that frustration will automatically create churn.
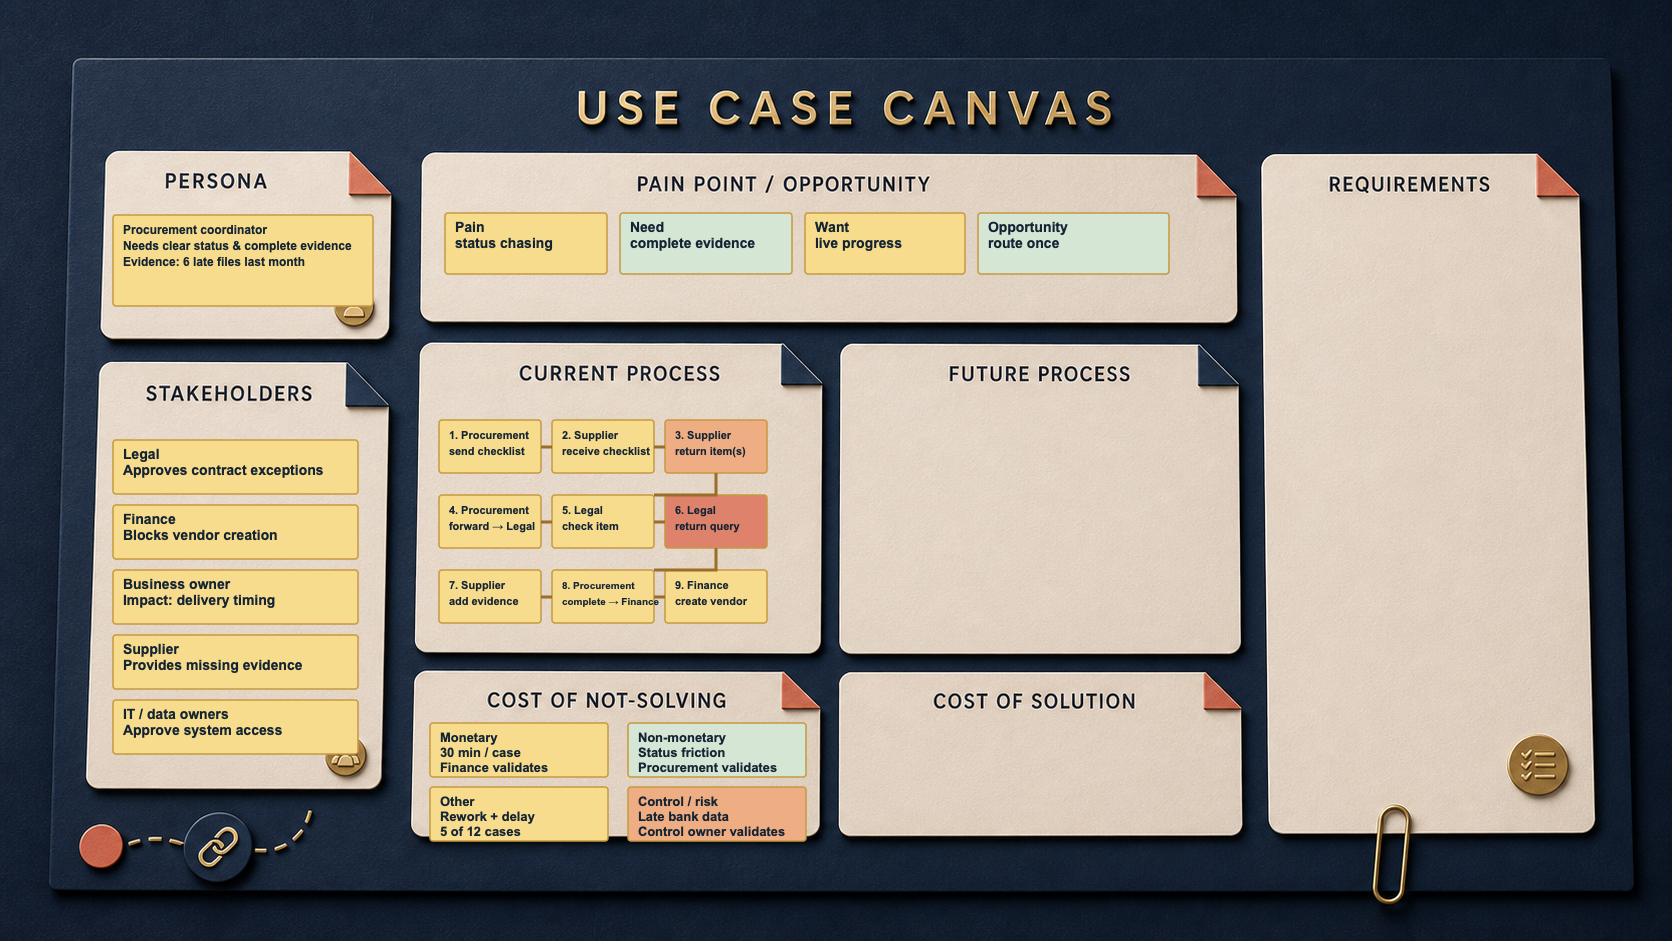
The team leaves with:
- a traceable evidence ledger, not an inflated ROI;
- ranges, counts, non-monetary signals and named risks kept separate instead of double-counted;
- named owners for finance, process, business consequence and control validation;
- a decision record: validate further, move to future-state options, or stop; and
- an explicit hand-off to Article 6 only if the comparison is worth making.
Make evidence-to-priority a leadership practice
Set up one short evidence-ledger format for material workflow, automation and AI proposals; agree usable sources and validation roles; and make a portfolio rule that an estimate cannot become more precise as it travels upward unless its evidence becomes stronger. Reuse the six categories, compare candidates by evidence quality as well as apparent pain, review estimates after normal cases and meaningful exceptions, and retain records when the organisation chooses not to solve a problem yet.
This is PathPatron’s role in the sequence: not a proprietary ROI model, but a reusable evidence-to-priority practice. The People lens asks whose time, trust or outcome is affected. The Process lens traces where the burden arises. The Power/Techniques lens keeps the eventual intervention and its controls honest.
Next: compare credible future states
This article does not approve a budget, promise savings, replace finance modelling or decide that a tool should be bought. It makes the current-state burden visible enough to earn — or decline — the next decision.
Article 6 compares credible future-state options and their cost, control burden and change load. That is where “do nothing”, standardise, automate stable work and add bounded AI assistance can be weighed honestly against the evidence collected here.
Continue the PathPatron Use-Case Canvas
- 1/7: The Monday-Morning Supplier Problem
- 2/7: The Supplier Case Has More Than One Owner
- 3/7: From Pain Point to a Real Use Case: Needs, Wants and Opportunities
- 4/7: Map the Work Before You Automate It
- 5/7: The Cost of Not Solving: Making Process Pain Visible — you are here.
- 6/7: From Current State to a Credible Future State: Cost, Control & Change
- 7/7: Requirements Engineering for AI-Enabled Work: Turn Your Use-Case Canvas into a Delivery Conversation